Want to Learn Data Analysis? | 매거진에 참여하세요
Want to Learn Data Analysis?
#SQL #Beginner #Define #Concept #Tech #Words #NoSQL
Want to Learn Data Analysis? Start Here.
For many of us in business or planning roles, data extraction once felt like someone else’s job.
Our responsibility was to analyze and report—not write queries.
But as I dug deeper into data analysis, I realized something important: being able to extract your own data is a superpower.
It’s where your intent, your hypothesis, and your logic come to life. That’s why I now tell every new team member:
“Learn SQL. Learn how to get the data yourself.”
Whether you're aiming to build a product strategy, optimize operations, or explore a career in data, this guide will help you understand why SQL is essential—and how to get started.

Why SQL Is the Language of Data Analysis
Structured Query Language (SQL) is the most widely used tool for managing and analyzing structured data.
If you're using a relational database—think rows and columns—SQL is how you ask questions.
It lets you:
Extract relevant insights from massive datasets
Clean and transform raw information
Build reports and dashboards that drive decisions
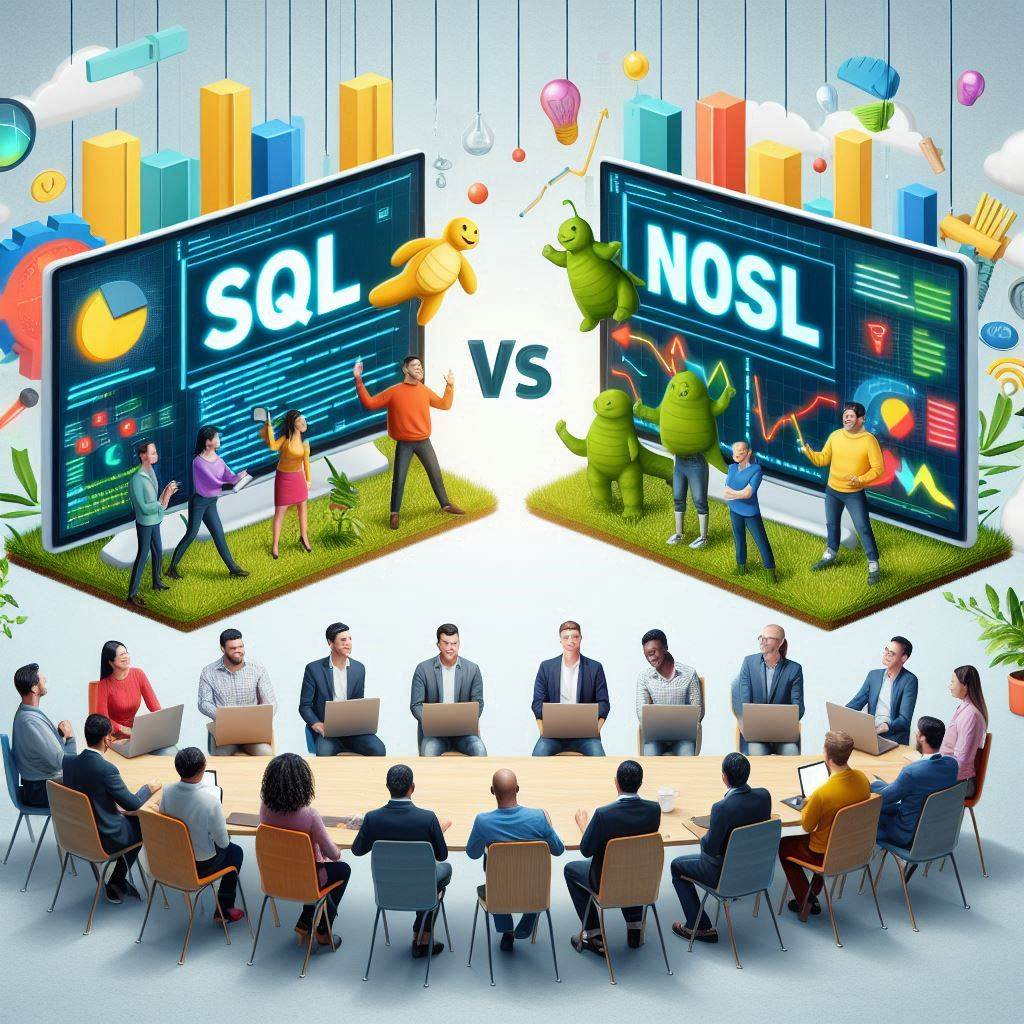
SQL vs NoSQL: What's the Difference?

Feature | SQL (Relational DB) | NoSQL (Non-relational DB) |
|---|---|---|
Schema | Fixed, pre-defined | Flexible, schema-less |
Data Structure | Tables (rows and columns) | JSON, documents, key-value, graph, etc. |
Scaling | Vertical (scale-up) | Horizontal (scale-out, distributed systems) |
Use Cases | Financial systems, inventory, CRM | Real-time analytics, unstructured content |
Tip: Learn SQL first. NoSQL is easier to understand later when you know the foundations of structured data.
Popular SQL Variants for Analysts
Platform | Best For | Notes |
|---|---|---|
MySQL | Beginners, small web apps | Lightweight, easy to install |
PostgreSQL | Complex queries, large datasets | Open-source, powerful features, strong ecosystem |
SQL Server | Enterprise, Microsoft stack | Great integration with BI tools (Excel, Power BI) |
SQL vs R vs Python: Which Should You Learn?
Tool | Strengths |
|---|---|
SQL | Data querying, filtering, joining |
R | Statistics, modeling, visualizations |
Python | Automation, machine learning, flexible ETL |
💡 Most analysts combine all three.
Starter Projects to Practice SQL
Here are some beginner-friendly ideas:
Sales Analysis: Track trends and KPIs from a fictional store
Customer Segmentation: Group buyers by behavior or region
Churn Prediction: Spot patterns in user retention
Inventory Optimization: Analyze stock vs. demand
Campaign Evaluation: Measure marketing performance
Core Concepts You Need to Understand
Databases: Structured sets of data stored electronically
Tables: Collections of rows (records) and columns (attributes)
Schemas: Definitions of how data is organized
Queries: Instructions written in SQL to interact with data
3 Must-Know SQL Operations
SELECT
Retrieve data from one or more tables
Filter using
WHERE, sort withORDER BY, limit rows withLIMIT
INSERT / UPDATE / DELETE
Insert new records, update existing ones, or remove outdated entries
JOIN
Combine data from multiple tables
Learn
INNER JOIN,LEFT JOIN,RIGHT JOIN, andFULL OUTER JOIN
Intermediate to Advanced SQL Techniques
1. Subqueries
Write a query inside another query to filter or aggregate data.
2. Aggregations & Grouping
Use functions like SUM(), AVG(), COUNT(), and GROUP BY to generate summaries.
Example:
SELECT customer_id, COUNT(*) AS total_orders FROM orders GROUP BY customer_id;
3. Data Cleaning with SQL
Remove Duplicates: Using
DISTINCTorGROUP BYHandle Missing Values: Use
IS NULL,COALESCE()Standardize Values: Convert case, format dates, fix typos
Real-World SQL: The Gaming Industry
In online games, SQL powers player data, match histories, scores, inventories, and more.
With hundreds of players online simultaneously, SQL ensures:
- Real-time data consistency
- Fast access to game assets
- Personalized content delivery
SQL isn’t just for banks or CRMs—it runs behind the scenes of dynamic, immersive environments.
Using SQL in Analytics Workflows
1. Data Cleaning
Fix inconsistencies, remove nulls, standardize formats
2. Data Transformation
Calculate new fields (e.g., revenue = unit × price), pivot data, join tables
3. Exploratory Data Analysis (EDA)
Use SQL to summarize, filter, and inspect distributions
4. Reporting & Visualization
Feed cleaned SQL data into Tableau, Power BI, or Excel
Build interactive dashboards and automate reports
Final Words: SQL as Your Compass
If you're just getting started with data analysis, SQL is the map and compass.
It connects questions to insights—and makes you a more self-sufficient, valuable contributor.
It may seem overwhelming at first, but start with the basics, build projects, and keep practicing.
You'll be surprised how fast you start speaking the language of data.


